
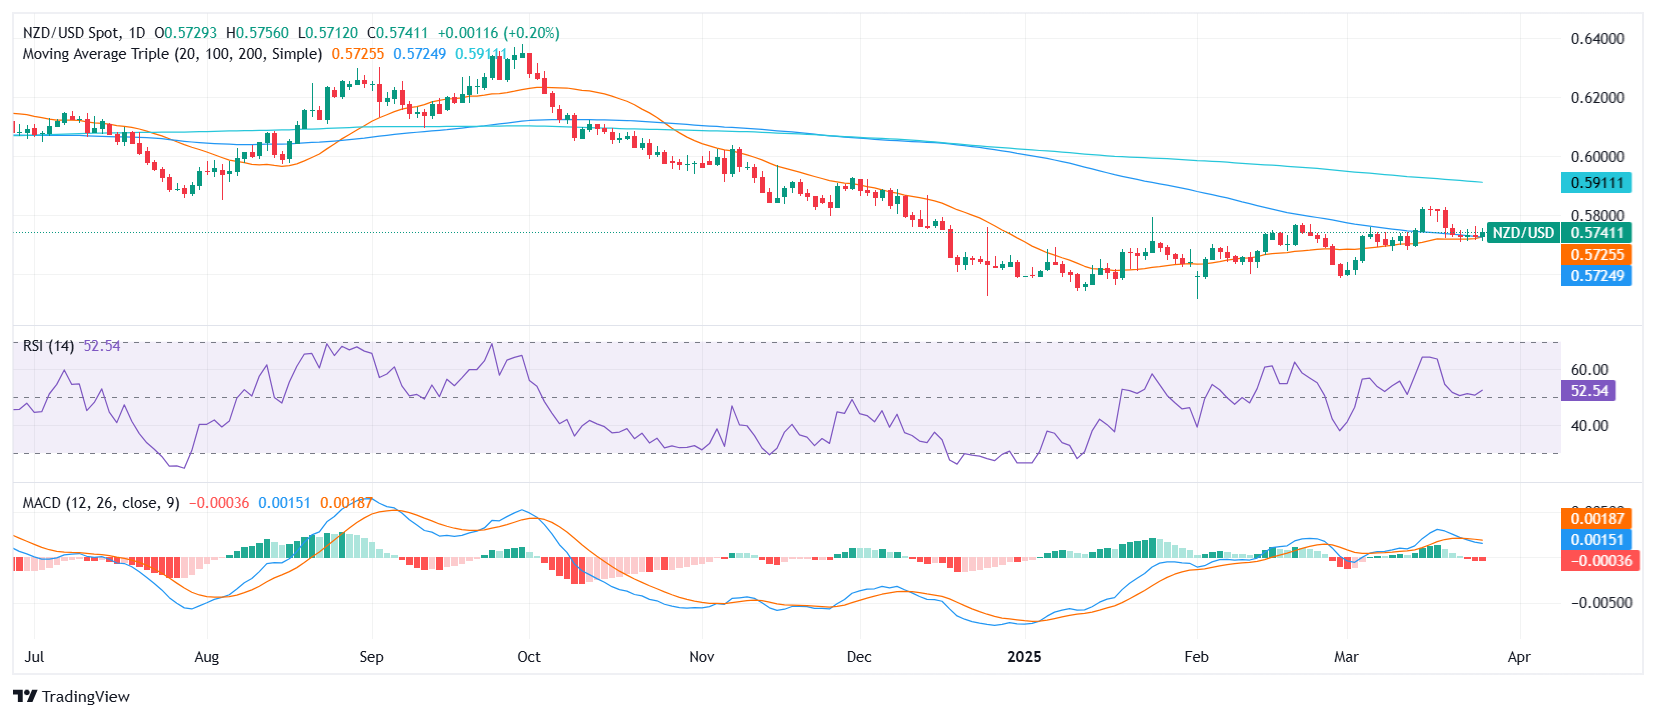
The NZD/USD pair is showing signs of upward movement, trading near the 0.5740 level. Here's a breakdown of the current market dynamics:
- Thursday's Gains: The pair posted modest gains ahead of the Asian session.
- Bullish Outlook: Supported by short-term moving averages, despite mixed oscillator signals.
- Key Levels: Support lies near 0.5725, with resistance clustered just above 0.5740.
- Upside Limit: Congestion around the 100 and 200-day Simple Moving Averages (SMAs) may restrict further gains.
Current Market Sentiment:
The Kiwi is trading near the upper end of its intraday range, bolstered by a slight improvement in sentiment. Short-term momentum appears positive, but mixed technical indicators suggest cautious trading.
Technical Indicators
Here's a look at the key technical indicators influencing the NZD/USD pair:
- Relative Strength Index (RSI): Neutral at 50.6.
- MACD: Indicates slight selling pressure.
- Bull Bear Power: Suggests mild buying interest.
- Short-Term SMAs: The 20-day SMA at 0.5725 and the 30-day Exponential and Simple Moving Averages at 0.5722 indicate a bullish trend.
- Long-Term SMAs: The 100-day and 200-day SMAs at 0.5732 and 0.5916, respectively, may create a congestion zone, limiting upward movement.
Key Support and Resistance Levels
Identifying crucial support and resistance levels can help traders make informed decisions:
- Support: 0.5725, followed by 0.5722 and 0.5720.
- Resistance: Immediate resistance at 0.5732 and 0.5740. A breakout above these levels could lead to a broader recovery.
Trading Tip: Monitor price behavior around the 100- and 200-day SMAs convergence, as this could serve as a pivot area for future directional movements.
Disclaimer: This analysis contains forward-looking statements and should not be considered investment advice. Always conduct thorough research before making any investment decisions.