The USD/JPY price analysis indicates increasing price pressures in Japan’s capital.
- Core inflation in Tokyo rose by 2.4%.
- The US economy grew by 2.4% in the last quarter, bigger than the forecast of 2.3%.
The USD/JPY price analysis indicates increasing price pressures in Japan’s capital that might convince the BoJ to keep hiking rates. As a result, the yen strengthened against the dollar on Friday. However, the greenback had also rebounded in the previous session after upbeat GDP data.
On Friday, data from Japan revealed that core inflation in Tokyo rose by 2.4%. Meanwhile, economists had expected a 2.2% rise. The hotter-than-expected price pressures will encourage BoJ policymakers to keep hiking interest rates.
Recently, Governor Ueda has noted that the central bank was ready to keep hiking as long as inflation stays above the 2% target. However, economists in a Reuters poll indicated that the next rate hike might come in July. At the moment, uncertainty regarding Trump’s tariffs and their impact on the economy might keep policymakers cautious.
On the other hand, the dollar recovered on Thursday after positive GDP data. The US economy grew by 2.4% in the last quarter, bigger than the forecast of 2.3%. At the same time, unemployment claims eased slightly from 225,000 to 224,000 last week. The upbeat data eased recession concerns, boosting the dollar. However, uncertainty regarding tariffs in April has kept market participants cautious. Moreover, traders eagerly await the core PCE price index report for more clues on Fed policy.
Key Events Today: Core PCE Price Index
Technical Analysis: Bears Emerge as 151.01 Resistance Holds Firm

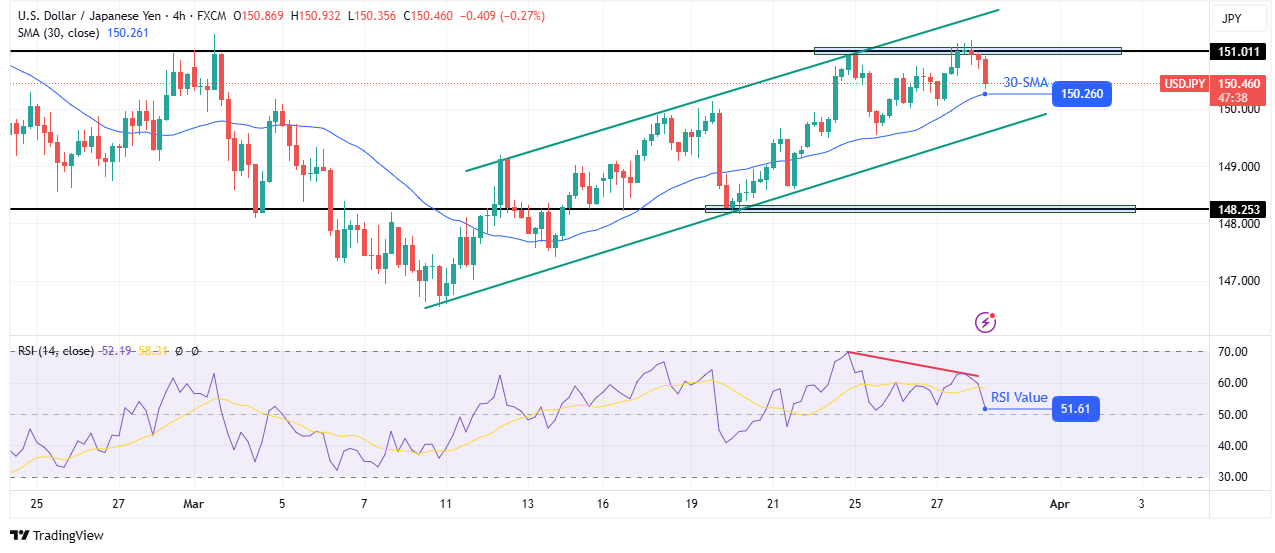
USD/JPY 4-hour chart
On the technical side, the USD/JPY price is falling towards the 30-SMA support after failing to break above the 151.01 resistance level. However, the bias is bullish since the price trades above the 30-SMA. At the same time, the RSI trades slightly above 50, suggesting strong bullish momentum.
Furthermore, the price trades within a bullish channel with clear support and resistance levels. However, bulls have shown some weakness at the 151.01 level. The price made a double top plus an RSI divergence that could lead to a deep pullback.
This means the price might break below the SMA to retest the channel support. However, if bulls remain in control, the price will bounce off the channel support to reach new highs. Sentiment will only shift if USD/JPY breaks below the channel support.
Looking to trade forex now? Invest at eToro!
68% of retail investor accounts lose money when trading CFDs with this provider. You should consider whether you can afford to take the high risk of losing your money.
</n </n
