Gold Technical Analysis: US CPI in Focus
Gold is currently exhibiting range-bound price action near its recent highs as investors await the US CPI report. The report is expected to significantly influence market movements. Let's delve into the technical analysis to understand potential future scenarios.
Fundamental Overview
The upward movement in gold prices is being restricted by the sell-off in the US stock market. This sell-off tightens financial conditions, creating a challenging environment for gold.
Adding to the complexity, recent economic data has been weaker than expected, while inflation expectations have been on the rise. This situation has sparked concerns that the Federal Reserve might be hesitant to cut rates swiftly enough if a slowdown occurs, potentially exacerbating economic challenges due to persistent inflation.
The US CPI report is a critical event that will likely set the tone for the week. Strong CPI data could trigger a gold sell-off, whereas weaker data might fuel another rally.
Daily Timeframe Analysis
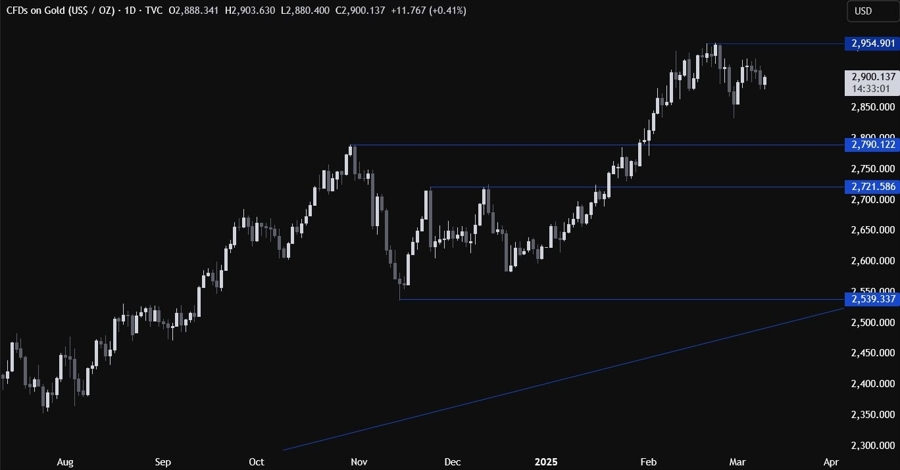
The daily chart indicates that gold has struggled to extend its rally to new all-time highs, primarily due to the ongoing sell-off in the US stock market. Further analysis requires a closer look at shorter timeframes.
4-Hour Timeframe Analysis
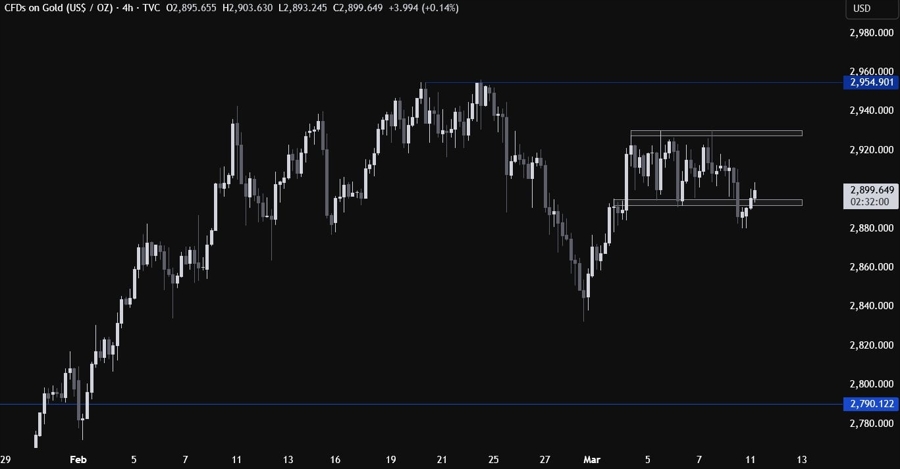
The 4-hour chart reveals that gold is trading within a range, with support around 2892 and resistance near 2930. A temporary break below the support level was observed recently. Buyers may likely enter around these levels, anticipating a rally towards the resistance. Conversely, sellers might look for another break below the support to drive the price down to the 2790 level.
1-Hour Timeframe Analysis

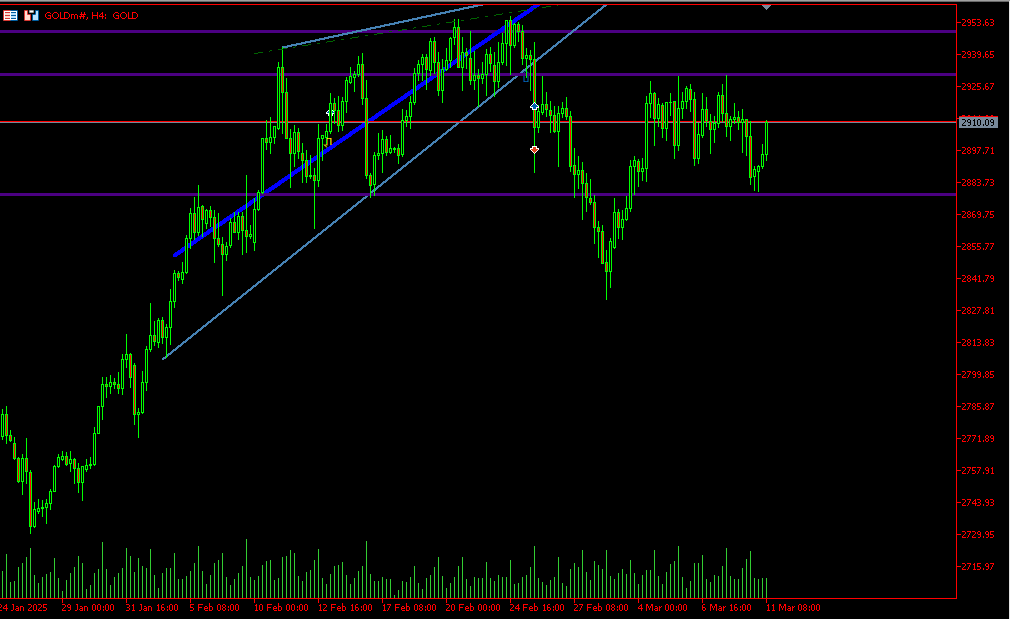
On the 1-hour chart, a minor downward trendline previously defined bearish momentum. The price has since broken above this trendline and is trading above the support zone. This development could encourage buyers to push the price towards the resistance. Sellers, however, will be watching for a break below the support to negate the bullish outlook. The red lines on the chart indicate the average daily range for the current trading day.
Upcoming Catalysts
- US Job Openings data (Today)
- US CPI report (Tomorrow)
- US PPI data and US Jobless Claims figures (Thursday)
- University of Michigan Consumer Sentiment report (Friday)
These economic releases are expected to influence gold prices significantly.